SaleForecast

AI-Driven Sales Forecast Tool

Upload Excel or CSV β†’ Get Instant KPIs & Forecast

Start Free Forecast Now β†’

πŸ’³ No credit card β€’ πŸ” No login β€’ 🎁 100% online

Validated by 20+ Retailers across the EU

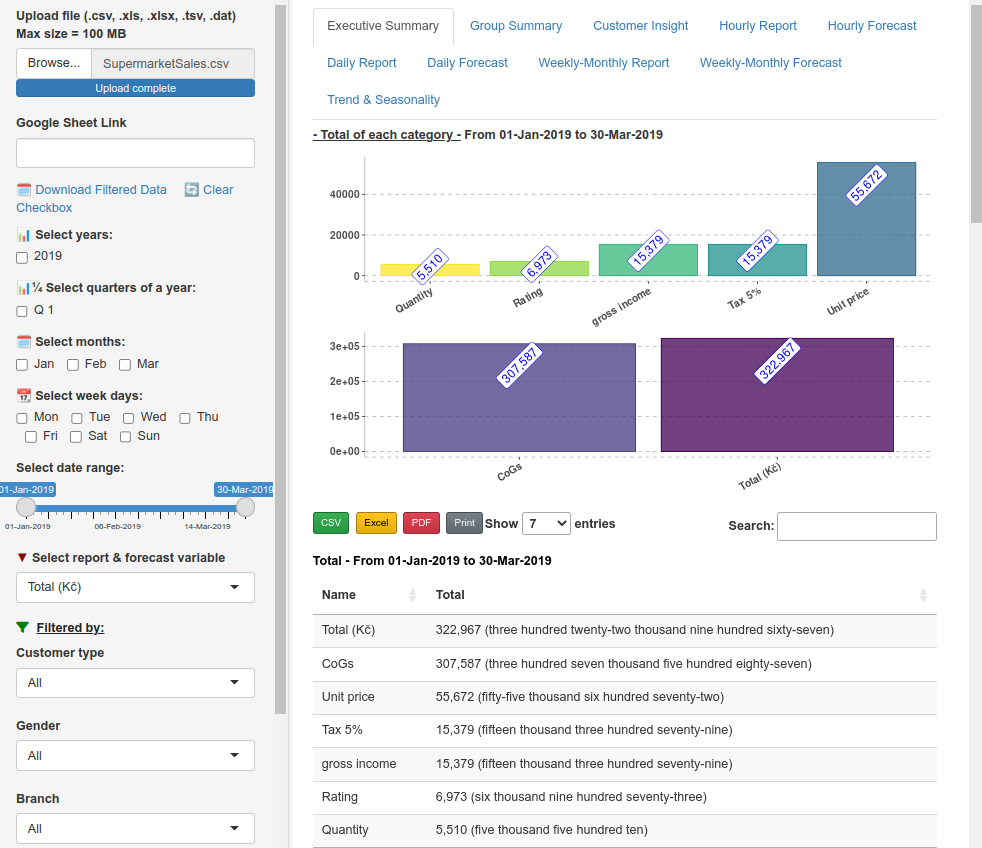
AI Sales Forecast Dashboard Preview

Example of KPI dashboard and AI demand forecast generated from real sales data.

Automated AI sales forecast dashboard showing weekly trends, demand predictions, and retail KPIs from a CSV upload

What is SaleForecast?

SaleForecast is an AI tool for retail, wholesale and e-commerce that predicts weekly, daily and hourly sales demand to improve inventory planning. It uses advanced time-series model, statistical analysis and intelligent dashboards where businesses can transform raw sales data into accurate forecasts and actionable insights. Whether you are looking for a forecasting dashboard in Europe or a simple online sales forecast tool, SaleForecast provides a fast, data-driven solution.

Why AI Sales Forecast Tool?

πŸ“Š 1-click Sales Analysis

Upload the historical CSV or Excel data file in 1 click. That's all it needs for results. πŸ’‘ Ensure the file contains only data.

⚑1-minute for 1M+ rows

Even the loaded data has 1 million+ rows, the tool creates a dashboard and provide KPIs & Forecast in 1 minute.

🧹 Automated Data Cleaning

No manual work. The tool will identify and clean unnecessary rows and errors, fill the time-series gaps for proper sequence.

πŸ€– AI Based KPIs & Forecast

The tool provides KPIs across product line. Machine learning models trained to generate upcoming sales demand.

Who Needs AI Sales Forecast Tool?

πŸ›’ Food & Drinks Manufacturing Company

Food wastage is a big problem nowadays. Some perishable product like meat, milk, cheese, yogurt, bread and pastries have a short life cycle. Instant Order-To-Deliver is not possible. The wastage can be reduced by predicting the upcoming sales demand.

🏭 Beauty & Cosmetics Manufacturing Company

Cosmetics require specific, often high-quality raw materials like plant extracts and vitamins. Forecasting allows manufacturers to order these materials from the trusted suppliers in advance, reducing costs and maximizing profit margins.

πŸͺ Textile and Footwear Manufacturing Company

The industry is heavily dependent on imported raw materials. Forecasting helps in planning the sourcing of fabrics, leather, and synthetic materials to avoid production delays and manage import lead times effectively. "Produce on Demand".

πŸ“¦ E-commerce Businesses

When importing from another country, sales forecasting helps an e-commerce company estimate demand in advance and order the right quantity to avoid delays or excess stock. It also helps manage shipping time, customs costs and overall import expenses.

Try AI Sales Forecast with Sample Supermarket Data

Experience how our AI Sales Forecast works using real supermarket sales data. No signup required β€” just copy, paste, and analyze.

🧾 Step 1 β€” Copy Sample Data Link

Open the supermarket sales dataset and copy the Google Sheet link:

πŸ”— Open Sample Supermarket Sales Data

πŸš€ Step 2 β€” Open AI Forecast Tool

Open the product and paste the copied Google Sheet link into the input box:

πŸ”— Open AI Sales Forecast Tool

πŸ“Š Step 3 β€” Get Instant Results

Click analyze and view:

  • βœ” Executive Summary
  • βœ” Hourly, Daily, Weekly KPIs
  • βœ” Demand Forecast
  • βœ” Trend & Seasonality
β–Ά Try Live Demo Now πŸ’‘ Tip: You can also upload your own CSV or Excel files for private analysis.

From Messy Data to Smart Decisions in 1 Click

Retailers and wholesalers face significant challenges in Excel spreadsheet when working with historical sales data, including identifying and filling missing timestamps, correcting inconsistent date-time formats, and removing irrelevant records from datasets. Without this essential data preparation, deriving meaningful insights or building reliable forecasting models is nearly impossible. The AI Sales Forecast Tool addresses these challenges by automating data cleaning. All it needs is just 1 click to upload historical sales data and the tool will generate KPIs and time-series forecast immediately. It helps retailers to initiate smart decision, such as planning inventory, staffing, and marketing more effectively.

Reduce Forecasting Time from 4 Hours to 1 Minute

Today, retailers and wholesalers struggle on manual Excel analysis and spend 4 expensive hours per days on average to identify KPIs and predict sales across product lines. Our AI sales forecast tool reduces those hours to 1 minute. Once you upload historical sales data, the tool will build an instant interactive dashboard. On the left side of dashboard, you can adjust date ranges, forecasting settings, and report filters. On the right side, you will see business-ready outputs such as summaries, KPIs, trend analysis, and time-series forecast by product group. It's more efficient and faster than traditional spreadsheet methods

Reduce Wastage Up to 18% in 2 Months

Perishable products such as meat, milk, cheese, yogurt, bread, and pastries have very short shelf lives, making instant order-to-delivery cycles unrealistic.Overproduction leads to waste, while underproduction results in stock-outs and lost sales. These challenges impact cash flow, safety stock levels, and overall supply chain efficiency. By predicting upcoming sales with an AI Sales Forecast tool, retailers can take a smarter, forward-looking approach that reduces both overstock and stock-outs up to 18%, keeping shelves full and waste low. In short, AI forecasting transforms inventory management from guesswork into precision , helping retailers to deliver fresher products to customers every day.

Manual Excel vs. SaleForecast AI

Feature Traditional Excel SaleForecast AI
Processing Time Hours or days of manual work Instant (under 1 minute)
Pattern Recognition Linear trends & simple averages Non-linear AI pattern detection
Seasonality & Holidays Requires complex manual formulas Automated holiday & seasonal logic
Inventory Wastage High (due to over-forecasting) Reduced by up to 18%
Data Scale Crashes with large datasets Scales to thousands of SKUs

Tools & Technology Used for SaleForecast AI

πŸ‘¨πŸΌβ€πŸ’» R/Shiny Programming

R is a statistical programming language and Shiny is an interactive web framework that turns R analyses into live dashboards.

πŸ€–ML Algorithms

Proprietary ensemble mathematical algorithms for time‑series forecasting (ARIMA, ETS, neural networks), automated data cleaning and statistical computing.

πŸš€ JavaScript Programming

Integrating JavaScript into Shiny extends the framework beyond native R limitations, transforming it from a data dashboard tool into a customizable web application.

πŸ“Š ggplot2

ggplot2 is a visualization package for the R programming language. It helps to create business‑ready report, charts for customer insight, KPIs & forecast analysis.

Built by Data Scientists & Validated by Retailers

Built by data scientists and validated by retailers, our free Sales Forecast Tool bridges the gap between advanced theory and real-world need. Data scientists contributed their expertise in demand forecasting and time-series modeling, while retailers provided real-world insights to ensure practical implementation. This tool has been rigorously tested and validated by over 20 retailers across the European Union, including demand, inventory, and production managers from the food manufacturing, retail, fashion, and e-commerce sectors.

Beyond Forecasting: The Future Roadmap of Retail Intelligence

Today SaleForecast Ltd transforms historical data into a high-accuracy forecast for inventory optimization and demand planning. We are powering the future of retail and wholesale by expanding our AI to include real-time price optimization and market volatility analysis. As an EU-registered startup from Latvia, we provide the KPI insights you need to meet demand and reduce wastage. Our upcoming platform expansion will use competitor signals and live market data to turn market fluctuations into growth opportunities. We are not just forecasting demand; we are forecasting your next big opportunity.

πŸ’° Price Optimization

Coming soon: Align your pricing with future demand and competitor signals.

πŸŒͺ️ Market Volatility Analysis

Analyze market shifts across product lines using live data feeds.

Frequently Asked Questions

Excel and CSV files usually contain three types of columns: date and time (for example, 17-12-2025 23:53:07), numeric values (such as sales amount), and grouping fields (such as product category or store). After you upload your file, the system automatically detects these column types and builds an interactive dashboard.

Yes. Your file should contain only raw data columns such as timestamps, numeric values, and grouping fields. Please remove charts, pivot tables, merged cells, formatting, or summary rows before uploading, as these can interfere with automated analysis.

The tool supports datasets with more than 1 million rows and file sizes up to approximately 100 MB. Larger files may take slightly longer to process, especially if the data contains many product groups or long time histories.

The tool uses established forecasting methods such as ARIMA, exponential smoothing, and neural network models. In typical retail datasets, forecast accuracy is usually between 80% and 90%, depending mainly on data quality, seasonality, and historical consistency.

Yes. The system applies time-series decomposition techniques such as STL (Seasonal and Trend decomposition using LOESS). This allows it to separate long-term trends, seasonal effects, and short-term fluctuations, helping you understand daily, weekly, and monthly sales patterns.

Yes. The tool is completely free and does not require registration, login, or credit card information. You can use it directly from your browser on desktop, tablet, or mobile devices.

Uploaded files are processed securely to generate your results and are not stored permanently on our servers. The data is used only for the current analysis session and is discarded after processing.

The tool is designed for retailers, wholesalers, manufacturers, and e-commerce businesses that need fast and simple demand forecasting without complex software setup. It is especially useful for small and medium-sized businesses that rely heavily on Excel-based reporting.

Absolutely. By recognizing hourly and daily sales patterns, you can predict exactly when you will be "busy" or "quiet." This allows you to schedule the right number of employees and order the correct amount of materials, reducing waste and labor costs.

Blog: Sales Forecasting Knowledge Hub

Learn proven forecasting techniques used by data scientists and retailers.

Why Data Cleaning Matters Before Forecasting

Handling Non-Constant Variance in Forecasting

Why Regression Isn’t Always Enough

Why Combining Forecasts Improves Accuracy

Decomposition-Based Forecasting Explained

STL vs Moving Average Decomposition

Do Residuals Affect On Your Forecast Accuracy

πŸ“š Knowledge Hub: Explore all our expert guides in the AI Sales Forecasting & Demand Planning Blog.

πŸ’‘ Founder's Insight: Read the latest forecasting deep dives on LinkedIn.

πŸ“Ί Video Case Study for Pizza Sales Forecasting β–Ά Watch AI Demo (4 min)